Attività magnetica della regione attiva AR 2546 il 22 maggio 2016
Magnetic activity of Sunspot AR 2546 on may 22 2016
Rilevazione ,in luce non polarizzata,nella AR 2546, dello splitting della riga del ferro a 6173 A nel nella regione attiva AR 2546 il 22 maggio 2016
Detection, in not polarized light,on sunspot AR 2546, of splitting in two different spectral lines of iron line at 6173 A, on may 22, 2016
Una regione attiva con una macchia di particolare grandezza per il periodo, la AR 2546, ha fornito il 22 maggio 2016 l'occasione per osservare lo splitting delle righe del ferro a 6173 A nonchè di tentare una misura comparata del campo magnetico in Gauss risultante dall'allargamento e dalla divisione della riga indotti dalla regione attiva in discorso .Tale fenomeno , com'è noto, prende il nome di effetto Zeeman inverso ed è molto difficile da osservare a livello amatoriale per le alte risoluzioni richieste allo spettrografo.
An active region with a particular
large size for the period, the AR 2546, has provided on May 22, 2016 the
opportunity to observe the splitting of iron line at 6173 as
well as of a comparative measurement of the magnetic field in Gauss resulting
from enlargement and from the splitting of the line induced by this active region .This
phenomenon, as we know, it is called the inverse Zeeman effect and
it is very difficult to observe at amateur level for high resolutions requested
to the spectrograph.
Un breve richiamo sull'effetto Zeeman inverso
A brief note on inverse Zeeman effect
Nella maggior parte degli atomi, esistono diverse configurazioni elettroniche che possiedono la medesima energia, quindi le transizioni tra differenti coppie di configurazioni corrispondono a una singola linea spettrale. La presenza di un campo magnetico esterno provoca la separazione dei livelli energetici, interagendo in modo differente con gli elettroni in funzione dei differenti numeri quantici e modificando leggermente le loro energie. Il risultato è che da differenti configurazioni che possiedono la stessa energia si ottengono energie leggermente diverse, che producono linee spettrali molto ravvicinate.
L'effetto Zeeman inverso consiste nell'allargamento o la divisione in più parti di una riga spettrale per effetto di una campo magnetico. In astrofisica, l'astronomo americano George Ellery Hale fu il primo ad osservare tale effetto sul campo magnetico delle macchie solari.Oggi lo stesso effetto viene sfruttato per ottenere magnetogrammi della superficie solare.
Più in particolare si può definire l'Effetto Zeeman come il fenomeno fisico collegato alla scomposizione dei livelli atomici di energia o delle righe dello spettro dovuta all'azione di un campo magnetico esterno.Pieter Zeeman, il fisico olandese che vinse nel 1902 il premio Nobel per la scoperta dell'effetto che da lui prese il nome, si accorse sperimentalmente che, in presenza di un campo magnetico orientato perpendicolarmente, alcune righe spettrali si scomponevano in tre righe diverse (effetto Zeeman ortogonale)) mentre con un campo magnetico orientato parallelamente all'oggetto le righe della scomposizione erano due, e quella centrale scompariva (effetto Zeeman longitudinale).Successivamente ci si rese conto che la scomposizione era molto più complessa di quanto apparisse e, in relazione allo spin dell'elettrone si parlò di effetto Zeeman anomalo o normale.Se la riga è in emissione si parla di Effetto diretto, mentre se è in assorbimento, di effetto Zeeman inverso.
Dal punto di vista dell'astronomia amatoriale, il fenomeno in questione è molto difficile da osservare per il semplice fatto che richiede poteri risolutivi spettrali molto elevati (a mio avviso > 60.000) ed una certa dimestichezza con le righe dello spettro solare per l'individuazione delle righe del ferro interessate al fenomeno, tra cui in primis quelle Fe1 a 6173 ed a 6302 A.La registrazione dell'effetto Zeeman sulle righe solari costituisce quindi una vera sfida per l'amatore che si occupa di spettroscopia e per la sua strumentazione.
In most of the atoms, there are various electronic configurations that possess the same energy, then the transitions between different pairs of configurations correspond to a single spectral line. The presence of an external magnetic field causes the separation of the energy levels, interacting differently with the electrons as a function of the different quantum numbers and slightly modifying their energies. The result is that for different configurations that have the same energy are obtained slightly different energies, that produce closely spaced spectral lines.The Zeeman effect consists in widening or in the division into more parts of a spectral line due to a magnetic field. In astrophysics, the American astronomer George Ellery Hale was the first to observe such an effect on the magnetic field of the sunspots .Today this effect is exploited to obtain magnetograms of the solar surface.More specifically you can define the Zeeman effect as the physical phenomenon linked to the breakdown of atomic energy levels or spectral lines due to the action of a magnetic field .Pieter Zeeman, Dutch physicist who won the Nobel Prize in 1902 for the discovery of the effect which bears his name, noticed experimentally that, in the presence of a magnetic field oriented perpendicularly, some spectral lines were blown to pieces in three different lines (Zeeman effect orthogonal) while with a magnetic field oriented parallel to the subject the lines of the splitting were two, and the middle one disappeared ( longitudinal Zeeman effect) .Subsequently it was realized that the decomposition was much more complex than it appeared and, in relation to the electron spin was talk of anomalous or normal Zeeman effect .If the line is in emission, we have a direct Zeeman effect, while if it is in absorbtion, we speak of inverse Zeeman effect.
From the point of view of amateur
astronomy, the phenomenon in question is very difficult to observe for the
simple fact that requires very high spectral resolution powers (in my opinion>
60,000) and a certain familiarity with the lines of the solar spectrum for the
identification of iron lines more affected to the phenomenon, including
primarily those at 6173 and 6302 A.Then recording Zeeman effect on the solar
lines is thus a real challenge for the amateur who deals with spectroscopy and
his instrumentation.
L'osservazione del 22 maggio 2016
The observation of may, 22 , 2016
1- Il target
Nella seconda metà di maggio 2016 è apparsa sul sole una regione attiva piuttosto intensa, numerata 2546, con una macchia di grande estensione, sicuramente la maggiore dell'anno, in un gruppo multipolare con un componente molto esteso altri componenti estremamente più piccoli.
In the second half of May 2016 it appeared an active region on the sun rather intense, with a spot of great extent, certainly the biggest of the year, in a multi-polar group with a very large component of other extremely smaller components.
.jpg)
La macchia 2546 a livello fotosferico il giorno 22 maggio 2016 , fonte SOHO-MDI
The sunspot at photospheric level (SOHO-MDI)

La macchia 2546 a livello cromosferico- foto dell'autore
The sunspot 2546 in cromosphere: photo of the author
2 - La strumentazione usata
The Equipment used
La strumentazione usata è stato lo spettrografo-spettroelioscopio digitale ad alta risoluzione Solarscan, sviluppato da chi scrive e dalla nota ditta Avalon di Aprilia (RM):Si tratta di uno strumento di alta qualità tecnologica e meccanica completamente automatizzato e remotizzabile, capace di risoluzioni superiori a 60000 in un peso di 15 Kg e una lunghezza di circa 110 cm, quindi perfettamente gestibile da una sola persona su montature di classe media come Losmandy G11 ed Avalon M1.Nel caso specifico lo strumento è stato montato su una Losmandy G11.La camera usata è stata una Imaging Source DMK 41 AS, con sensore Sony ICX 205 AL e pixel da 4.65 micron, con la quale è stato ottenuto un filmato dello spettro di 800 frames mediati con Registax senza alcuna forma di elaborazione (solo stacking).
The equipment used was the
high resolution spectrograph-digital spectrohelioscope Solarscan,
developed by writer and known firm Avalon of Aprilia (RM): It is a fully automated
and high
technological quality instrument and capable of resolutions higher
than 60000 in a weight of 15 kg and a lenght of about 110 cm, therefore
perfectly manageable by one person on medium-class mount as Losmandy G11 and
Avalon M1.The camera used has been an
Imaging Source DMK 41 AS, with a ICX 205 AL Sony sensor and 4.65 micron pixels,
by which was obtained a video of spectrum of 800 frames ,stacked by Registax
with no kind of processing
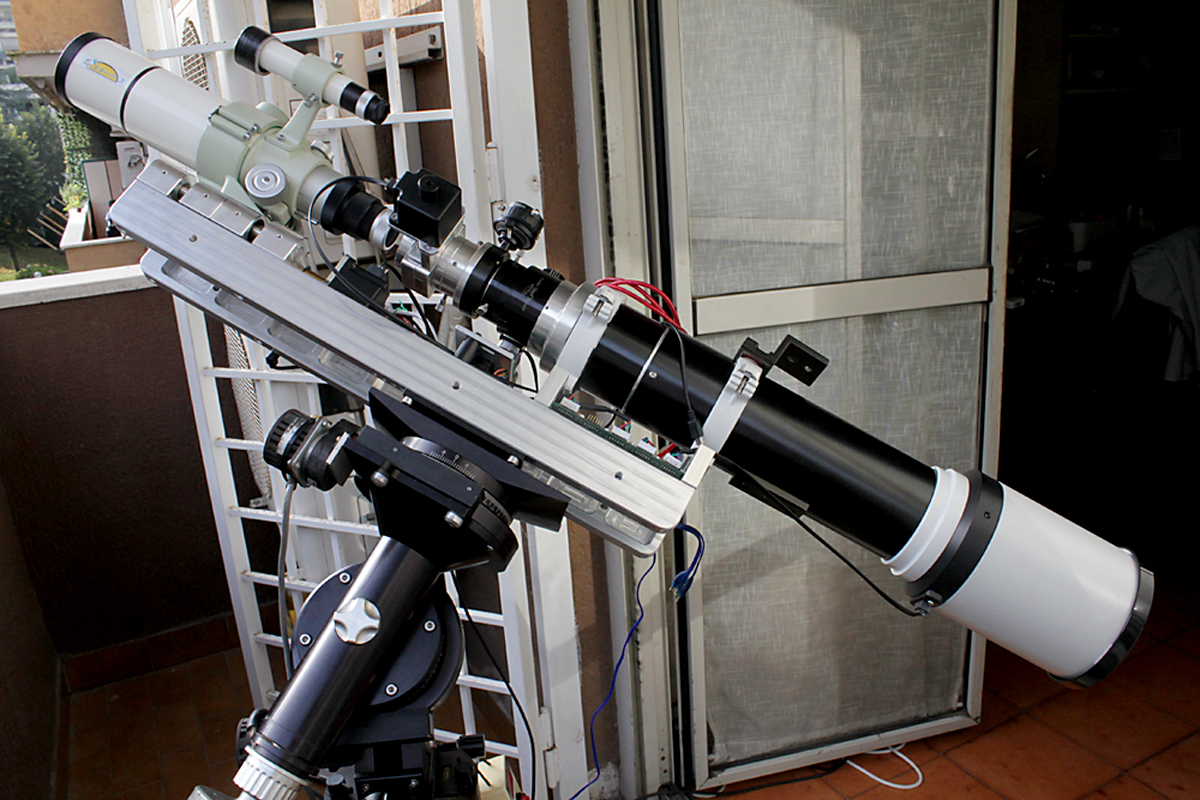
Lo spettrografo Solarscan sulla Losmandy G11 dell'autore
Solarscan Spectrograph on the Losmandy G11 mount of the author
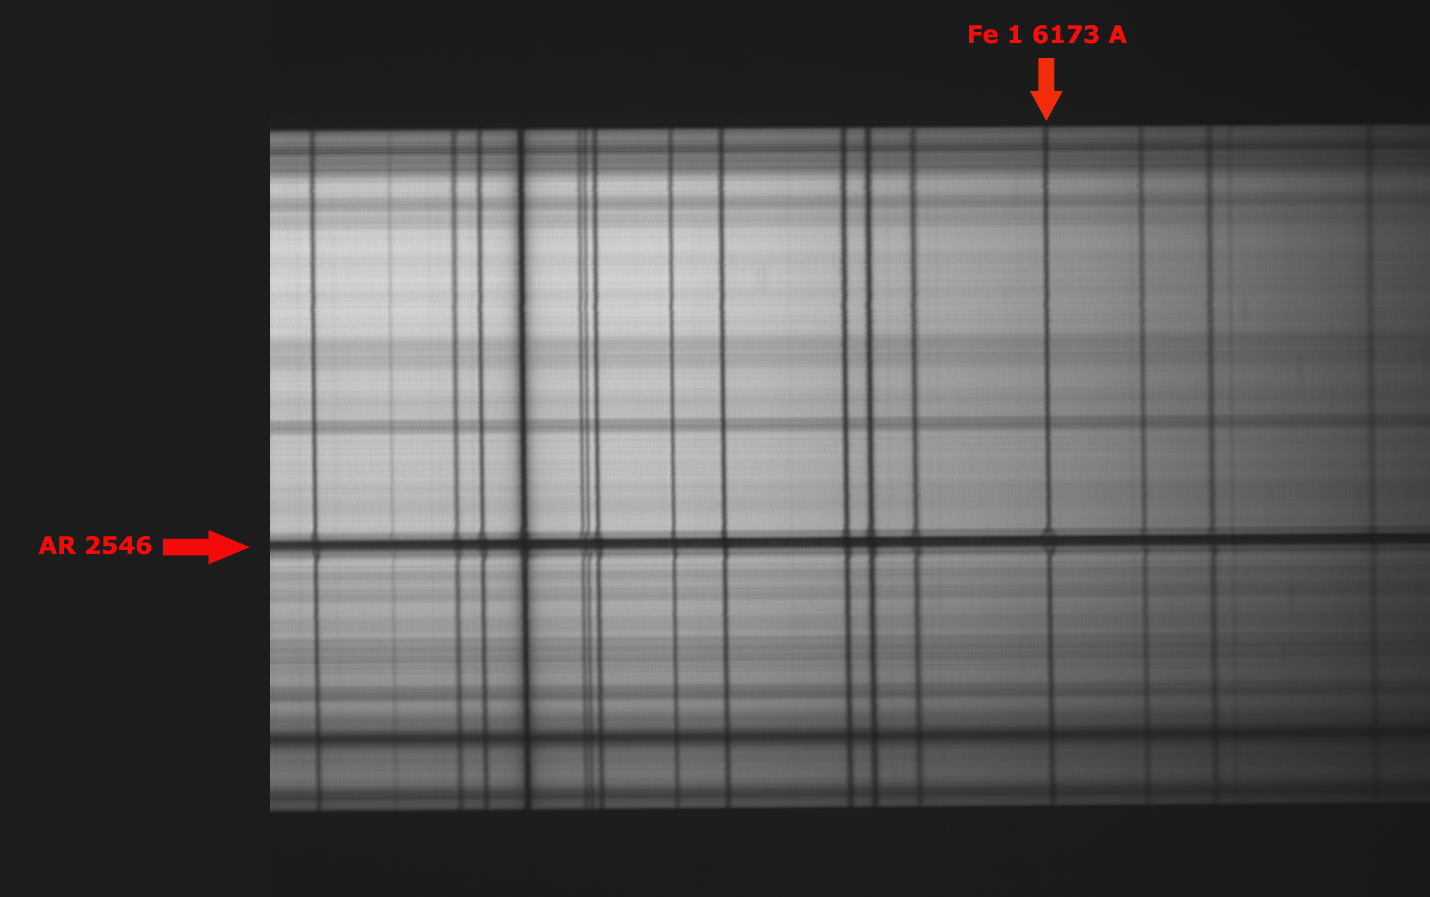
Per ottenere la massima risoluzione utile senza che il tranversalium (le righe orizzontali dovute a diffrazione od imperfezioni della fenditura) rovinassero lo spettro, la fenditura è stata chiusa a circa 0.15 micron (1/67 di mm) e la messa fuoco è stata particolarmente curata. La dispersione è stata di 0.021 A/pixel e la risoluzione di circa 60.000 nella zona spettrale interessata .Lo spettro bidimensionale della riga Fe1 a 6173 A si presentava come segue
For maximum useful resolution without the tranversalium (horizontal lines due to diffraction or imperfections of the slit) could ruine the spectrum, the slit was closed at about 0.15 microns (1/67 mm), and the focus has been particularly cared .Dispersion was of about 60.000 in the spectral zone, and the two-dimensional spectrum of FE1 line at 6173 A was as follows
3 - La scomposizione della riga Fe1 a 6173 A
The splitting of the line Fe 1 at 6173 A

Lo splitting si notava su buona parte delle righe del ferro presenti nella zona , ma sulla riga 6173 era particolarmente accentuato e visibile sulle due ali ,ed un leggero filtro wavelet lo ha reso ancora più evidente
The splitting was visible on most part of iron lines, but on the line 6173 was nuch more visible both on the blue and red wing, and a light wavelet filter made it more evident
E, ingrandendo:
and,zooming:

La riga con i centri delle due righe splittate
Si trattava quindi di un effetto Zeeman inverso longitudinale;e da esso si poteva risalire al campo magnetico in Gauss della macchia che lo aveva generato usando un'apposita formula, a patto di poter determinare con esattezza le dimensioni in Angstrom dello splitting della riga.Ho cominciato quindi a selezionare , in Visual Spec, nello spettro bidimensionale originario ottenuto, la parte relativa all'ombra e penombra della macchia, ottenendo il profilo seguente:
It was therefore a reverse
longitudinal Zeeman effect, and it could be traced back to the magnetic field in
Gauss of the sunspot that had generated it using a special formula, assuming
that one can define exactly the angstrom size of splitting of the line. Then I
began to select, in Visual Spec, in the original two-dimensional spectrum
obtained, the part on the umbra and penumbra of the sunspot, getting the
following profile:
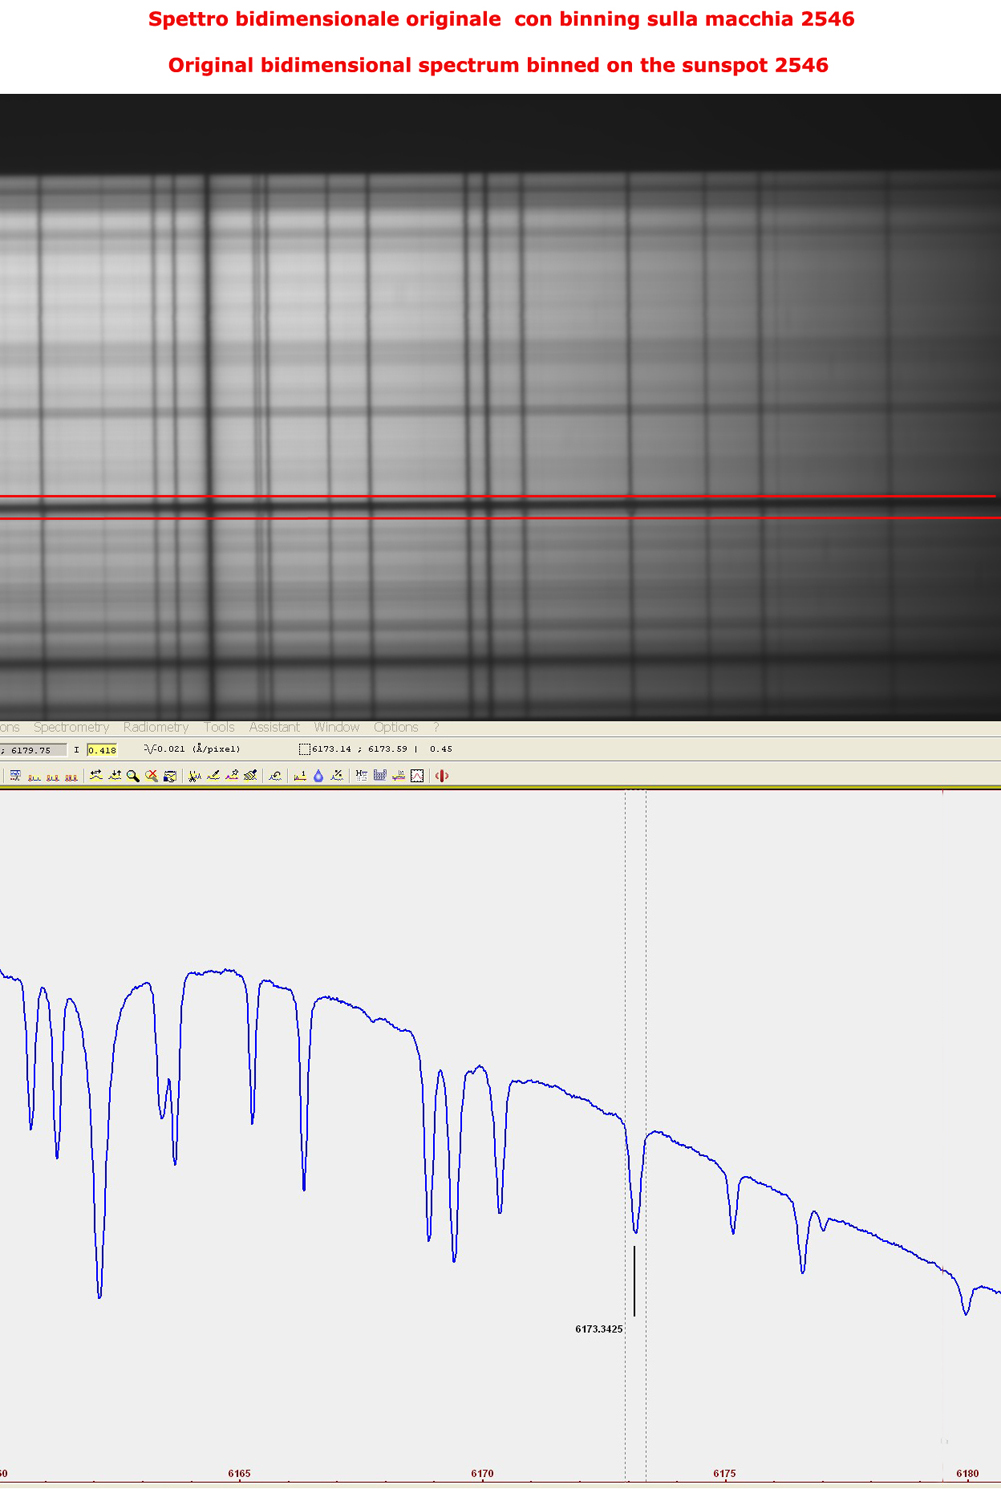
Tale profilo, non mi dava , tuttavia la possibilità di distinguere con precisione lo sdoppiamento della riga, e, ricorrendo alla FWHM od alla EW si ottenevano risultati ambigui e sfalsati.
4- La misura della scomposizione della riga nei due elementi
The measurement of the splitting of the line in two elements
4 a - La penombra
4 a - Penumbra
Ho allora provato , sullo spettro bidimensionale col filtro wavelet , ad effettuare il binning sulle regioni al confine tra ombra e penombra della macchia,sopra e sotto l'ombra stessa nella quale lo splitting era più evidente, ottenendo i profili che seguono, nei quali lo sdoppiamento della riga era misurabile.
Such a profile did not give me,
however, the way to distinguish the splitting of the line with the
precision required, and, using the FWHM or to EW were obtained biased results.
I then tried ,in the two-dimensional spectrum with wavelet filter, to perform binning on the regions on the border between umbra and penumbra of the
sunspot,up and down the umbra where the splitting was more evident, getting the profiles that follows,
in which the splitting itself was measurable .
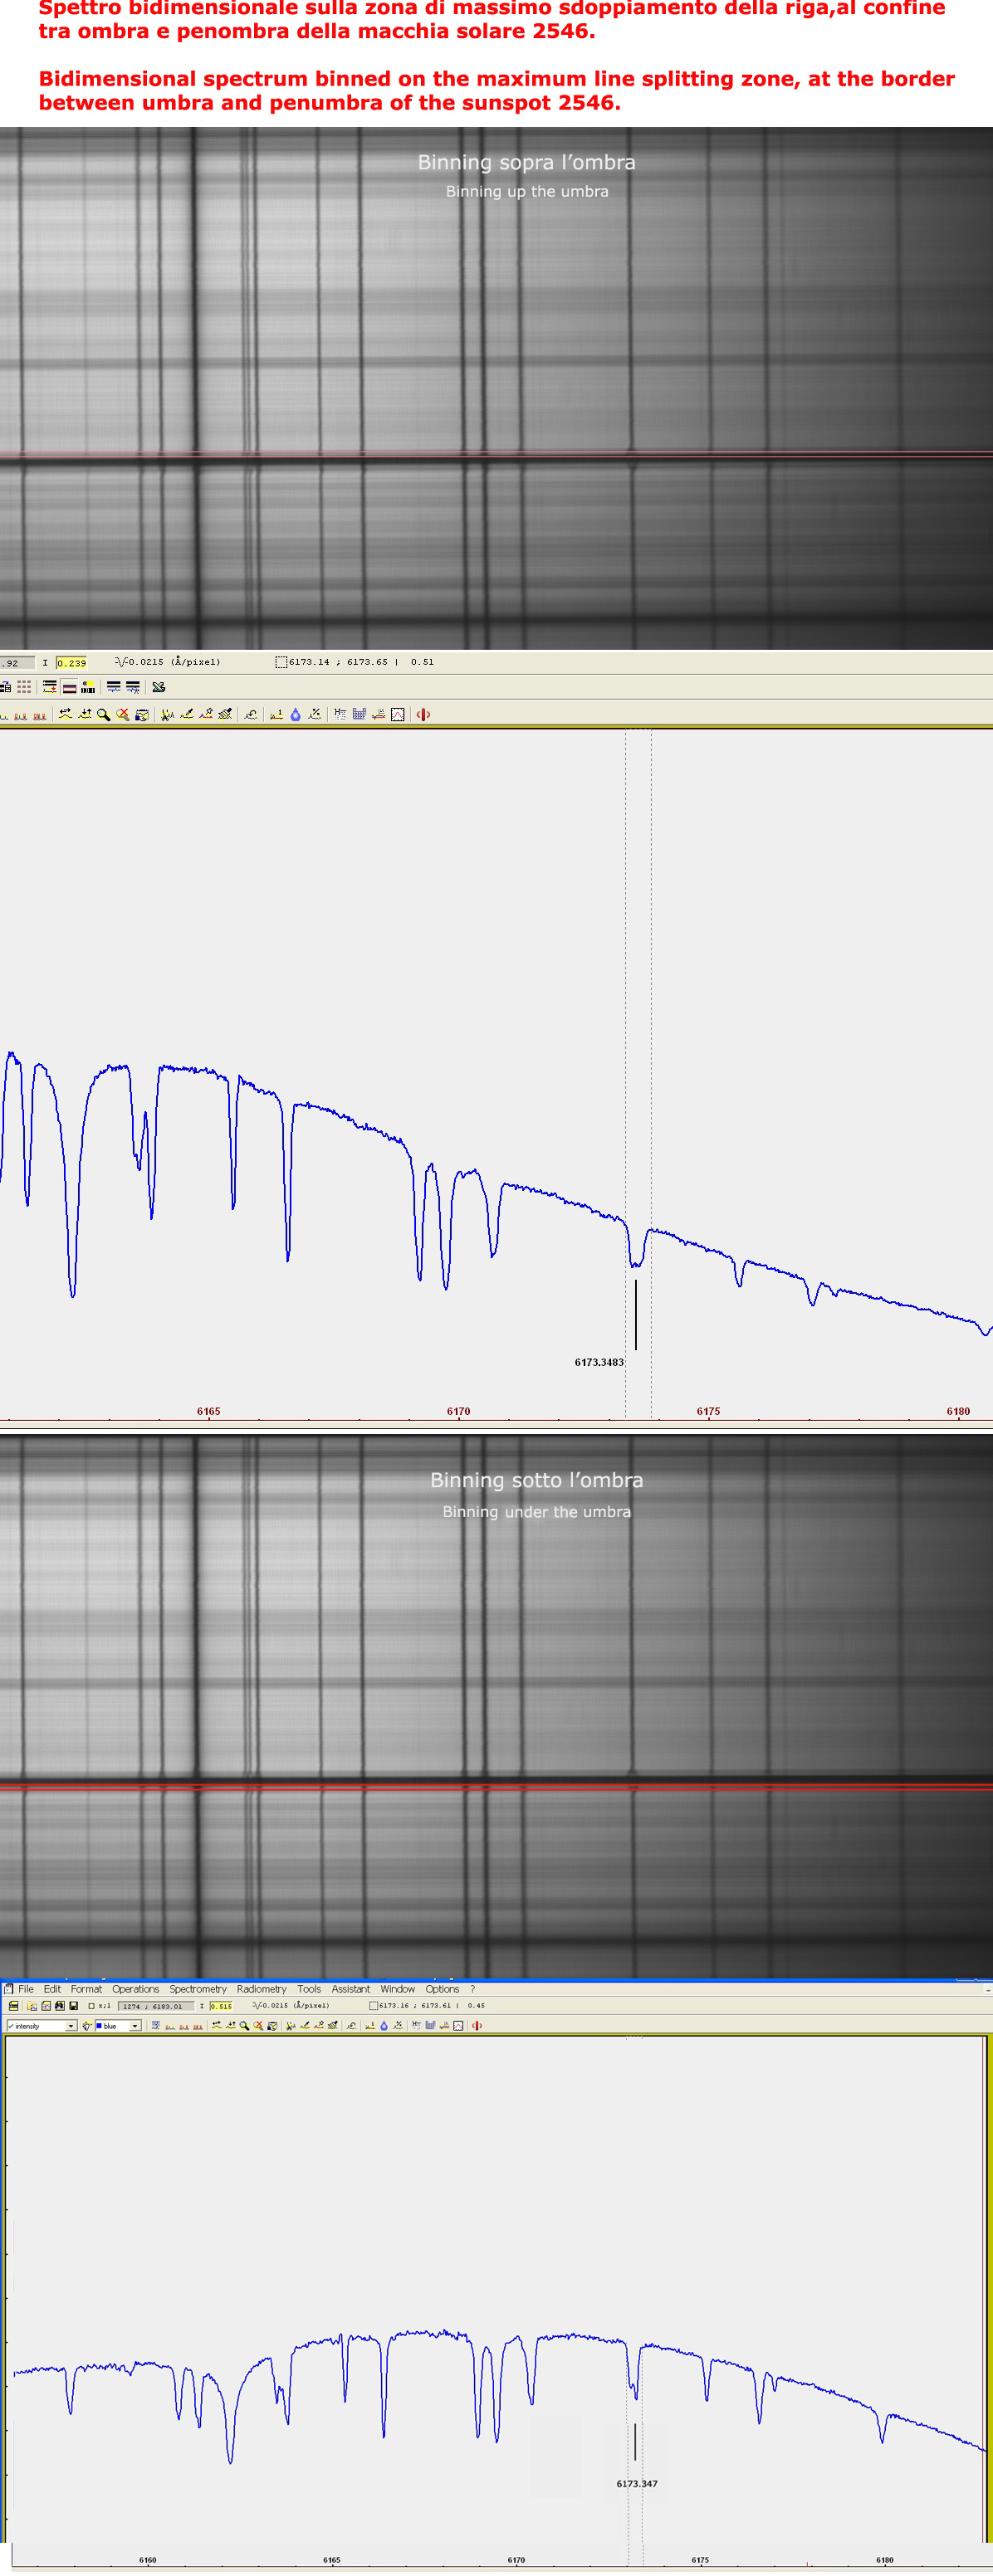
Si trattava ora di misurare lo splitting in Angstrom con Visual Spec, ricorrendo alla routine "line center" nel menù a tendina "Computation preferences" del menu " Spectrometry".La distanza molto piccola tra le due righe rendeva tuttavia estremamente facile la possibilità di errori, per cui ho ritenuto opportuno mediare tre misure del centro riga sulla riga a destra, verso il blu, e tre su quella a sinistra, verso il rosso.Tale procedura è stata effettuata sia per lo sdoppiamento sopra l'ombra che al disotto dell'ombra.Sopra l'ombra il risultato della media è stato il seguente: 6173.2499 A (blu) - 6173.4219 (rosso)e la differenza tra i due valori è stata quindi pari a 0.172 A.Sotto l'ombra la separazione (mediata) è stata di 6173.252 A (blu) - 6173.419 (rosso) e la differenza tra i due valori è stata quindi pari a 0.167 A. Ho allora effettuato la media tra i due valori, ottenendo un delta lambda medio complessivo (da una parte e dall'altra rispetto al centro riga) pari a 0.169 A.Tale valore va diviso per due per ottenere il D lambda effettivo di 0.0845 A da applicare alla formula
Potevo passare ora conosciuto il delta lambda sul confine ombra- penombra ,alla fase successiva di misurazione del relativo campo magnetico.
It was time to measure the splitting in Angstrom with Visual Spec, resorting to the routine "center line" in the dropdown menu "Computation preferences" of "Spectrometry" menu .The very small distance between the two lines, however, made extremely easy the possibility of errors , so I thought it appropriate to average three measures of the center of line on the line on the right, toward blue, and three on the one on the left, toward the red , for both the two profiles.The result of the average was as follows: 6173.2499 A (blue) - 6173.4219 (red) up the umbra, and 6173.252 (blue) and 6173.419 (red) under the umbra. The difference between the first two values was equal to 0.172 A,and that of the second two values of 0.167 A.The further average of this two values, equal to 0.169 A gave a sufficient affordable value of overall delta lambda (from a side to the other respect to the center of the line) .Such a number must be divided by two to get the effective D lambda of 0.0845 to apply to the formula.
So, known delta lambda ,I could switch to the next phase of the magnetic field measurement.

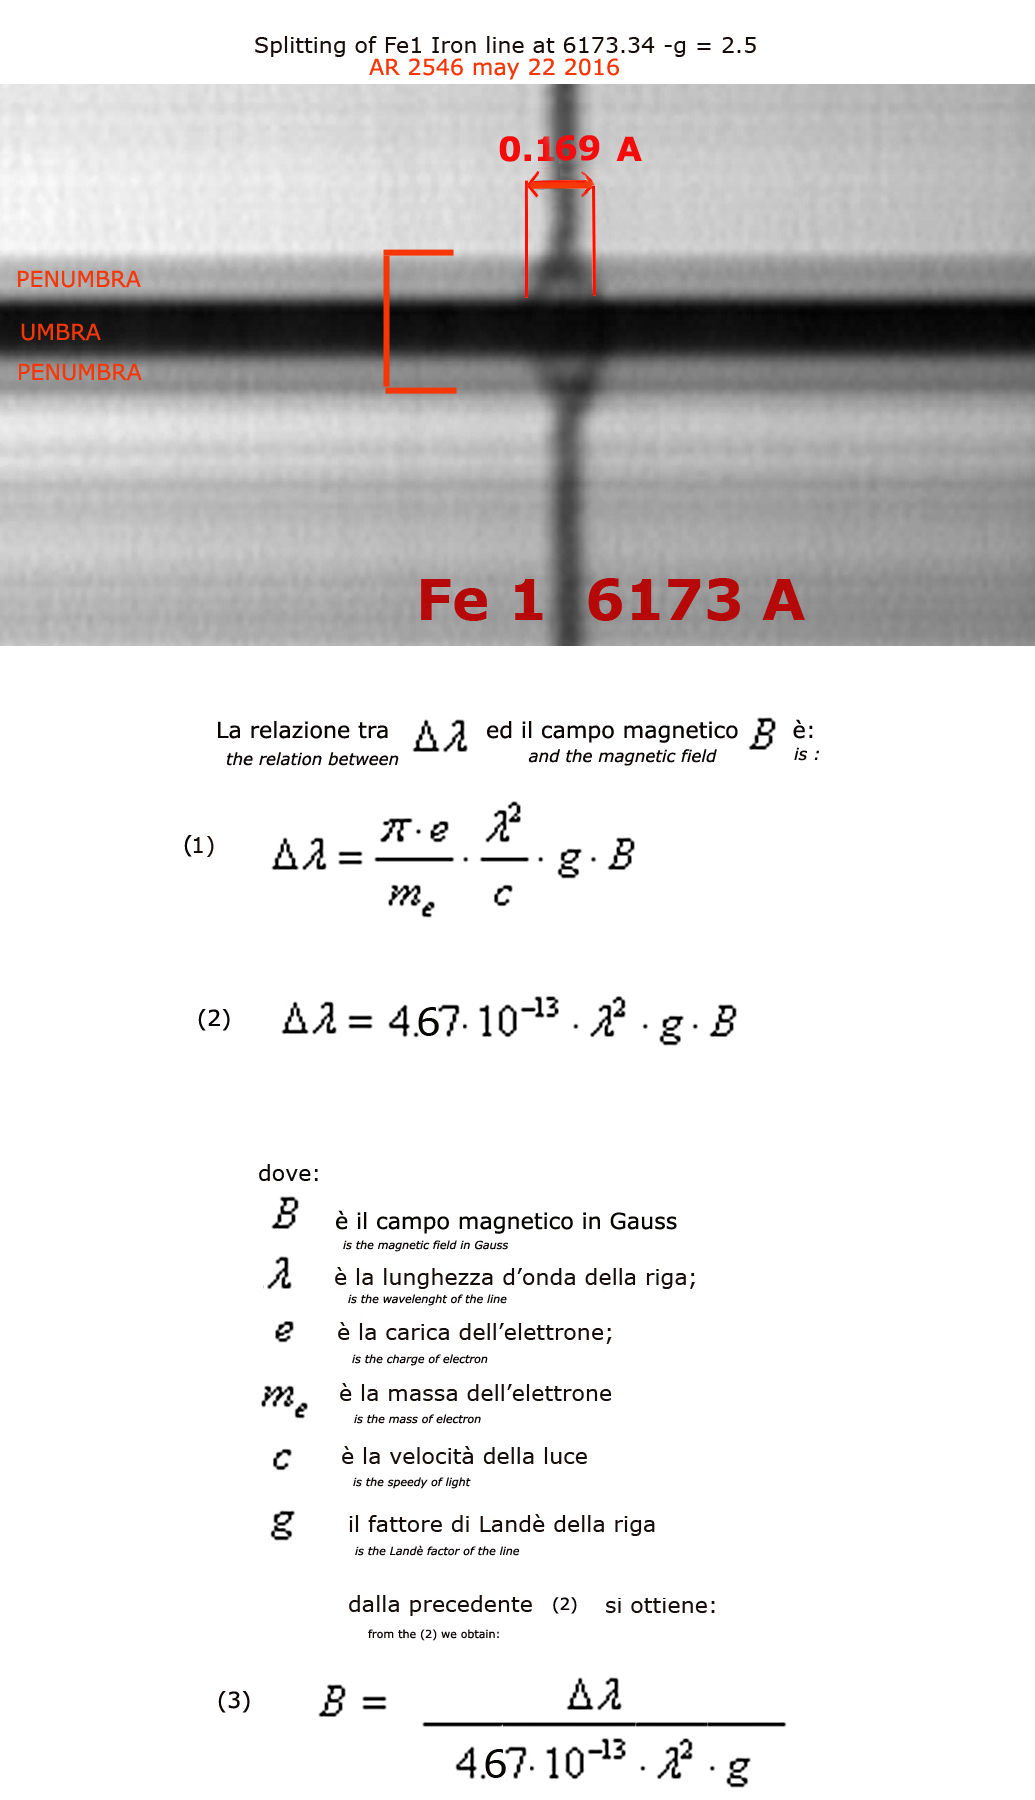
Applicando la formula (3) sul D lambda di 0.0845 e tendo conto che il fattore di Landè della riga Fe1 a 6173 A è pari a 2.5 ,si ottiene:
Applying the formula (3) and considering that the Landè factor of Fe1 line at 6173 A is 2.5, I obtained

4 b - Umbra
4b - Umbra
Ho in un primo tempo rinunciato a prendere il profilo spettrale dell'ombra, che consideravo illegibile nello spettro bidimensionale, tuttavia, con mia grande sorpresa, Visual Spec è riuscito ad estrarre anche dalla zona quasi nera dell'immagine un profilo, che valuterei con cautela, ma che tuttavia ha sicuramente un notevole grado di attendibilità e che mi sento comunque di riportare nella sua elaborazione.E' bene comunque precisare che la misura dei campi magnetici nelle ombre delle macchie solari molto scure come quella in esame non è un compito facile nemmeno per i professionisti, data la scarsa incisione delle righe splittate e la loro difficoltà di lettura.
I at first declined to take the
spectral profile of the umbra, which I considered illegible in the
two-dimensional spectrum, however, to my surprise, Visual Spec managed to
extract even from almost black area of the image a profile, I'd take with
caution , but which it could also have a certain degree of confidence and I feel
still to bring in its elaboration.It 's worth pointing out that the measurement
of magnetic fields in the umbra of the very dark sunspots such as this is not an
easy task even for professionals, given the poor record of splitted lines and
their reading difficulties.


Fatta la solita media di tre misure per entrambe le due righe splittate nell'ombra, questa era pari a 6137.2479 verso il blu 6137.4537 verso il rosso.La differenza tra i predetti valori di 0.2058, divisa per 2 come in precedenza , risultava di 0.1029 A e, applicando la formula (3), risultava:

Tale ultimo valore è sicuramente concreto, in quanto deriva da misure effettuate con un software collaudato e preciso.
Tirando le somme, sono stati estratti i valori dei campi magnetici di ombra e penombra della macchia solare 2546 .In ogni caso entrambi i valori sembrano coerenti tra loro (la differenza è inferiore a 2 pixel nello spettro bidimensionale) e con il trend della forza dei campi magnetici delle macchie solari degli ultimi anni, come riportato nelle recenti pubblicazioni sul tema.
This latter value is undoubtedly
less reliable than the last, but certainly not far-fetched, as derived from
measurements made with a proven and accurate software.
Summing up, they extracted the values of the magnetic fields of umbra and
penumbra of the sunspot 2546 and.In any case both values seems consistent with the trend
of the strenght the magnetic fields of sunspots in recent years, as reported in
recent publications on the topic.
Sembrerebbe tutto finito,ma occorre anche considerare i numerosi fattori di errore, presenti nelle riprese professionali, figuriamoci in quelle amatoriali.
Dette fonti di errore possono così riassumersi:
1- Seeing
Nel giorno della ripresa ci fu un seeing medio,dovuto ad assenza di vento e la stessa e stata effettuata alle prime ore del mattino, 7.48 TU quando i moti convettivi di origine termica dovuti al riscaldamento dell'aria erano minimi, quindi è possibile affermare che l'allargamento delle righe dovuto al seeing fu senz'altro trascurabile.La fenditura molto chiusa ha inoltre contribuito non poco al risultato come si può anche osservare dalla parte superiore della riga nell'immagine che segue.
2- Fenditura
Molto più del seeing contano, a mio avviso, gli errori dovuti alla chiusura della fenditura a 15 micron, osservabili nell'immagine sottostanteTali errori sono assolutamente inevitabili quando si usano fenditure commerciali (quelle professionali da ricerca vanno lavorate almeno ad 1/4 di Lambda e costano migliaia di euro). Del resto una chiusura della fenditura a 15 micron, e quindi molto stretta, come quella in esame ha fornito già un risultato molto buono ed ha permesso da sola il raggiungimento della risoluzione necessaria per osservare lo splitting.Tanto per intenderci , una chiusura a 30 micron ed un risoluzione conseguentemente dimezzata non avrebbe permesso di osservare il fenomeno e tanto meno quantizzarlo con precisione.Relativamente all'errore in questione,questo appare molto contenuto nelle zone di binning e peraltro compensato dalle medie effettuate .

3- Errori di inseguimento della montatura:
la modesta durata del filmato (ca 1 minuto) hanno reso trascurabile l'errore, sempre presente in montature commerciali specie in alta risoluzione.
4-Effetto Evershed che provoca una deformazione dell'assorbimento nella zona di penombra della macchia:
Non dovrebbe essere percepibile se non per risoluzioni d lambda superiori a 2/100 (0.02) A, mentre si aggira sui 0.10 A.
5-Errore del software usato, dovuto in parte all'inclinazione delle righe dello splitting nella zona di penombra.
In conclusione, una quantizzazione di tali fattori di errore separatamente presi appare molto difficile in questa sede, si può tuttavia prendere in considerazione un errore assoluto statistico complessivo derivante dalla metà della differenza tra i valori massimo e minimo delle medie dei centri delle righe splittate (0.172-0.167)/2 pari a 0.0025 A, a sua volta equivalente a 56 Gauss.Potrei quindi dire che il valore del campo magnetico della macchia è pari a 1899 +- 56 Gauss per la penombra. Stesso discorso per l'ombra, dove però vanno considerate solo le differenze tra i massimi e minimi delle tre misure dei centri riga nel blu e nel rosso (0.095 e 0.025) la cui differenza divisa per 2, pari a 0.0035 A, equivale a 79 Gauss circa.La forza del campo nell'ombra dovrebbe quindi valere 2313 +- 79 Gauss
It would appear all over, but we
must also consider a number of error factors, present in professional detection,
let alone in those of amateurs.
Such sources of errors can be summarized as follows:
1- Seeing
On the day of the shooting there was an average seeing, due to lack of wind and
the same was carried out in the early hours of the morning, 7:48 UT when the
convection fluxes of air of thermal origin due to the warming were minimal, so
you can say that enlargement of the lines due to the seeing was certainly
negligible.The slit very closed also contributed greatly to the result as can be
observed from the top of the line in the image below.
2- Slit
More of seeing matter, in my opinion, the errors due to the closure of the slit
to 15 microns, observable in the upper image .Such errors are absolutely
unavoidable when using commercial slits (those ranging from professional
research work at least 1/4 Lambda and costing thousands of Euros). Moreover
a very narrow 15 micron slit, such as this has already provided a very good
result and has allowed to achieve the resolution necessary to observe the
splitting of the line. For instance, a closure to 30 microns of the slit and a
consequent lower resolution would not let us watch the phenomenon.Anyway this
error looks very small in binning areas and partially offset by the
average performed above and below the umbra.
3- Tracking Error of the mount:
the short duration of the movie (about 1 minute) have made negligible error.
4-Effect Evershed
It should not be perceived except by d lambda resolutions greater than 2/100
(0.02) A, while ours is about 12:10 A.
5-Error of the software used, in part due to the inclination of the lines of
splitting in penumbral zone.
In conclusion, a quantization
of these factors of error taken separately appears very difficult here, you may,
however, take into account an overall absolute error from half the difference
between the maximum and minimum values of the averages of the centers of
splitted lines (0.172- 0.167) / 2 equal to 0.0025 A, equivalent to
56 Gauss.I could then say that the value of the magnetic
field of penumbra of the sunspot is equal to
1899 + - 56 Gauss.Same goes for the umbra, where, however, should
be considered only the differences between the highest and lowest data of the three centers of the line
measurements in the blue and red (0.095 and 0.025) whose difference divided by
2, of 0.0035 A, is equivalent to about 79 Gauss. the strength of the field in
the umbra should then amount to 2313 + - 79 Gauss
5 - Il confronto del risultato con gli articoli scientifici sulla questione
5 - The comparison of the result with scientific articles about the topic
Si è acceso negli ultimi anni un approfondito dibattito sulla ricerca effettuata da Penn e Livingston nel 2011 sui dati forniti dal NSO Kitt Peak McMath-Pierce telescope sullo splitting Zeeman della riga Fe 1 a 15648 A, che, ad avviso dei predetti , mostravano un costante calo nei valori in Gauss dei campi magnetici delle ombre delle macchie solari durante il ciclo 23 e l'inizio del 24, al punto da far ritenere, perdurando il trend, la quasi totale scomparsa della macchie nel corso del ciclo 25.
It occurred on in the last few years a thorough debate on the research carried out by Penn and Livingston on 2011, on data provided by the NSO Kitt Peak McMath-Pierce telescope on the Zeeman splitting of the Fe line 1 to 15648 A, which, in the view of the above, showed a steady decline in values in Gauss magnetic fields of the umbra of sunspots during cycle 23 and the beginning of 24,at the point to suggest,if the trend persists, the almost complete disappearance of the spots during cycle 25.

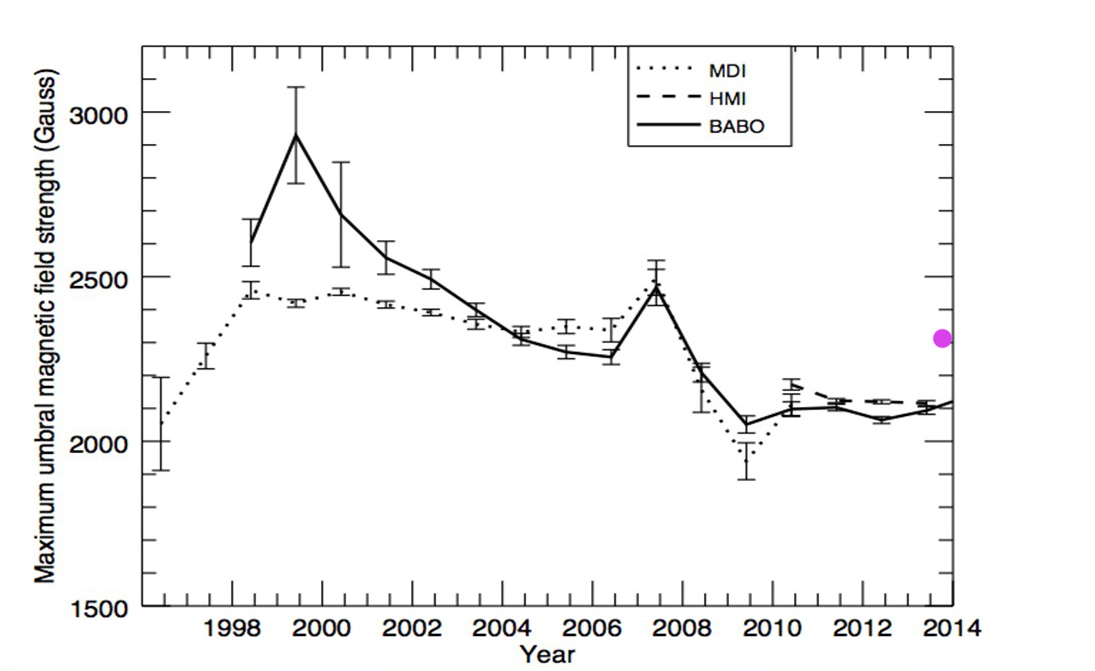
Una successiva ricerca di Fraser Watson (NSO) nel 2014 sui dati MDI, HMI e BABO sviluppò il trend risultante nell'immagine sottostante:

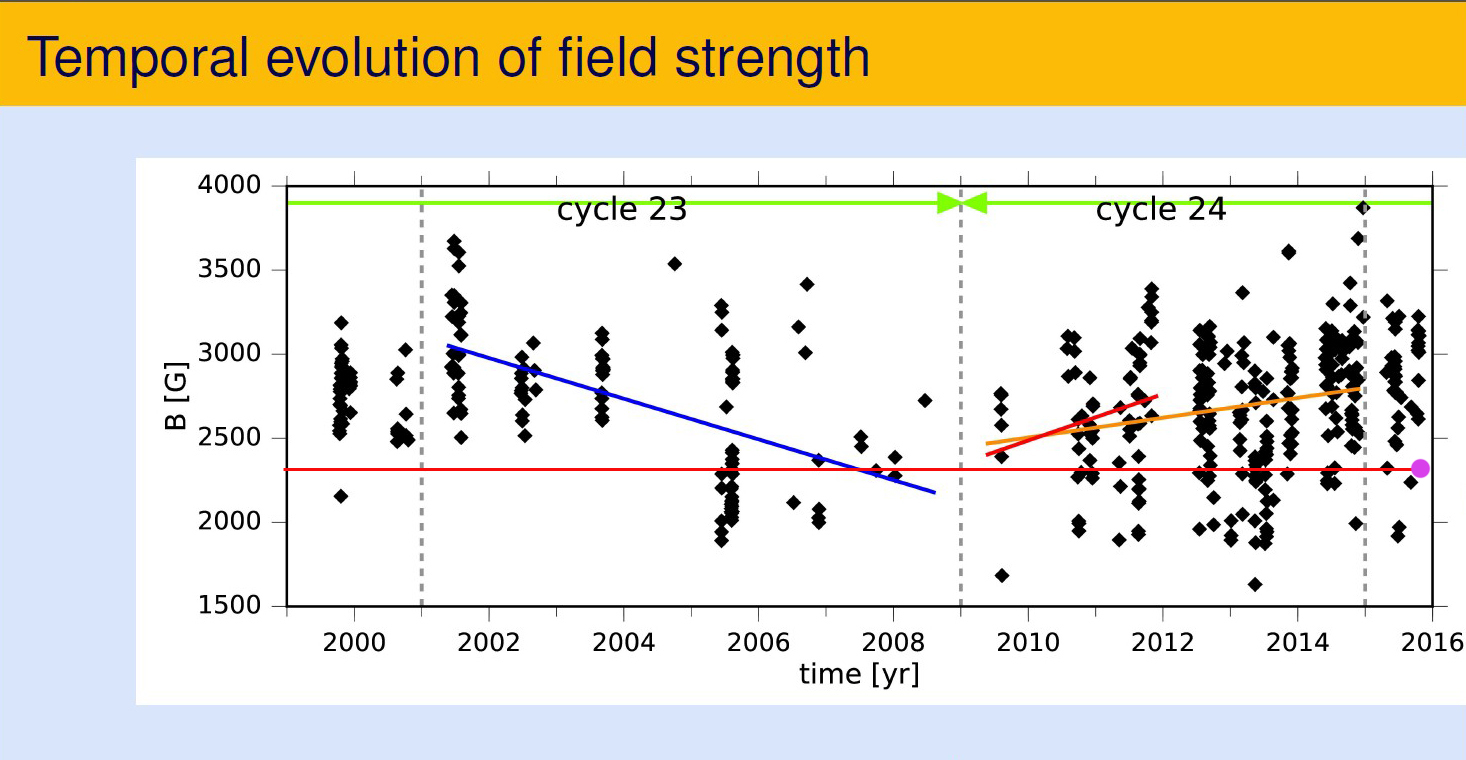
La ricerca di Penn e Livingstone sembra poi essere stata confutata da dati più recenti, (Reza Rezaei ed altri) che ,da osservazioni effettuate sulle righe del Fe1 nell'IR vicino, mostrano che la diminuzione della forza dei campi magnetici è molto più contenuta delle valutazioni di Penn e Livingstone o addirittura non esiste affatto, come risulta dal diagramma che segue.
Such research seems then to have been refuted by more recent data (Reza Rezaei and others), from observations made on the lines of the FE1 in the near IR , showing that the decrease of the strength of magnetic fields is much smaller of Penn and Livingstone assessments or even not exist at all, as shown in the diagram below.
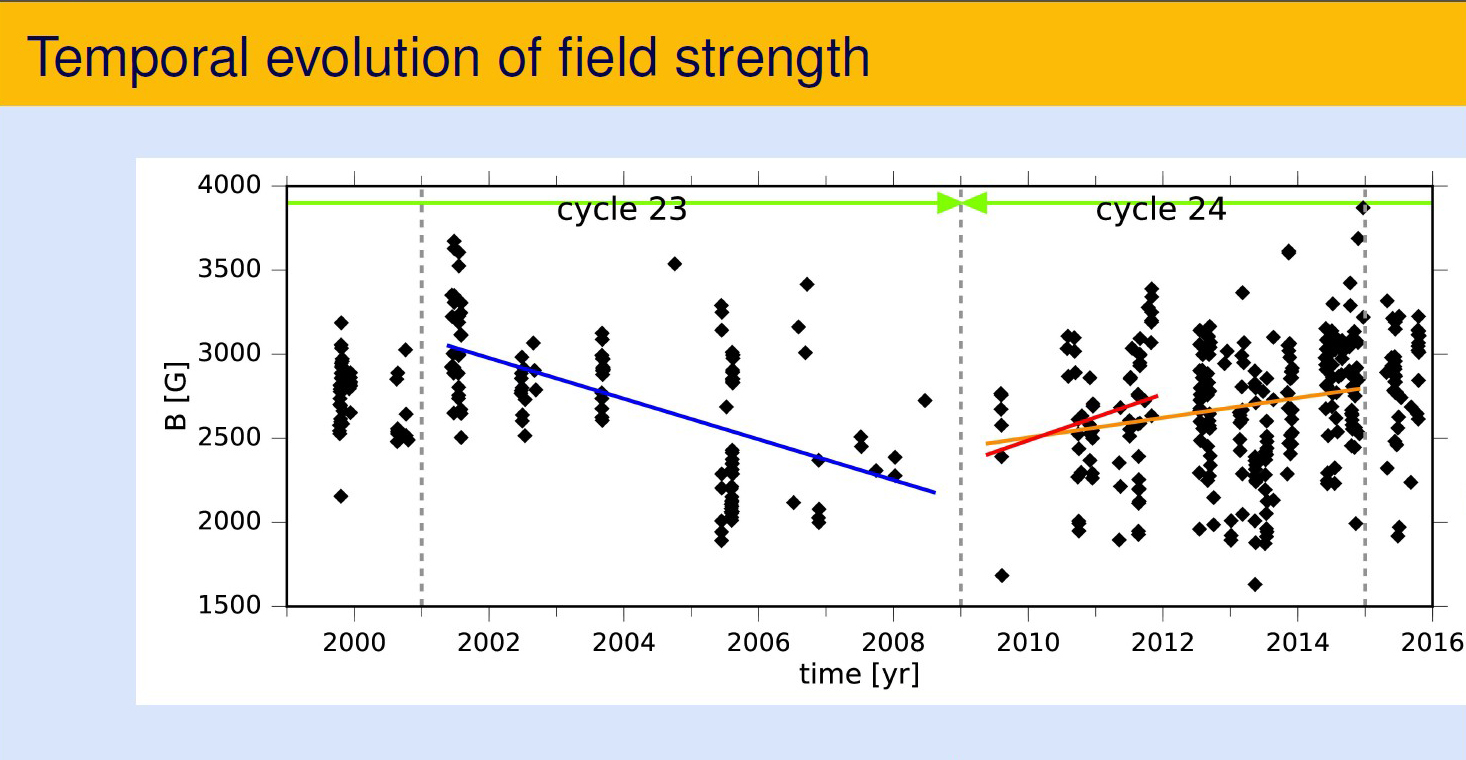
Il valore di B dell'ombra dell'AR 2546 da me trovato risulta abbastanza compatibile con i dati più recenti del 2016 sul ciclo 24 di Reza Rezaei e completamente compatibile col trend risultante dall'indagine di Fraser Watson , piuttosto che con il trend proposto da Penn e Livingstone, come si può osservare dall' elaborazione delle precedenti immagini con la mia osservazione contrassegnata da un pallino viola.Naturalmente si tratta di un solo dato, ricavato nel visibile e con una strumentazione amatoriale, ma è comunque un contributo, forse utile in un momento in cui la dinamica dei campi magnetici solari sembra non seguire i trend previsti.
The value of B in umbra of AR 2546 which I found is quite compatible with the most recent results on the 24-cycle and fully compatible with the trend resulting from the survey of Watson on MDI , HMI and BABO data, rather than with the trend proposed Penn and Livingstone, as can be observed from processing of previous images, with my observation marked by a violet dot .Of course it is a single data, in the visible and obtained by an amateur equipment, but it is a contribution in a moment in which the trend of magnetic field in the sunspots seems not to follow the forecasts.

